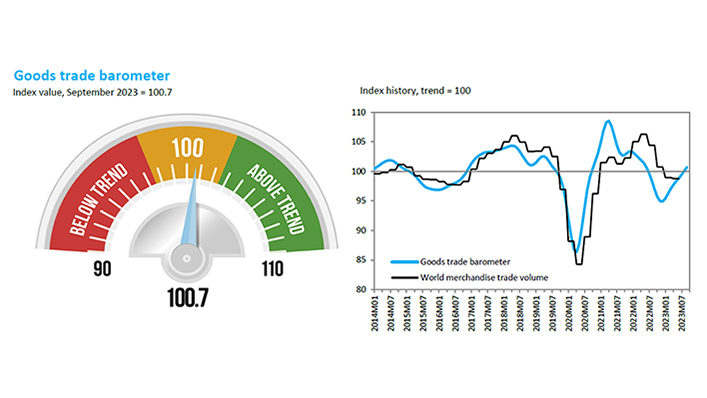
The current reading of 100.7 for the barometer index is above the previous reading of 99.1 from last August and close to the baseline value of 100. This suggests that merchandise trade volume will gradually revert towards its medium-term trend in the second half of 2023, although uncertainty remains high due to mixed economic data and rising geopolitical tensions.
The Goods Trade Barometer is a composite leading indicator for world trade, providing real-time information on the trajectory of merchandise trade relative to recent trends. Barometer values greater than 100 are associated with above-trend trade volumes while barometer values less than 100 suggest that goods trade has either fallen below trend or will do so in the near future.
World merchandise trade volume was flat in the second quarter of 2023, up 0.2% compared to the previous quarter but still down 0.5% year-on-year. Trade statistics for the third quarter should come in slightly stronger thanks to accelerating GDP growth in the United States and China, even as a stagnant European Union economy continued to weigh on global demand.
Year-on-year trade growth is likely to be strong in Q4 in any case due to the reduced amount of trade in the same period last year as high energy prices, rising interest rates and pandemic-related disruptions weighed on economic growth in leading economies. These developments are consistent with the WTO’s forecast of 5 October 2023, which foresaw an 0.8% increase in global trade volume in 2023. While the forecast remains unchanged, risks to the trade outlook have shifted towards the downside in light of recent developments in the Middle East.
The barometer’s component indices are mixed, with some rising firmly above trend and others remaining on or below trend. The biggest gains were seen in the indices for automobile sales and production (110.0) and electronic components trade (109.8). The indices for air freight (100.3), export orders (99.4) and container shipping (98.0) finished on or slightly below trend, while the raw materials index (95.6) sank below trend.
The strength of the automotive products and electronic components indices may be explained by surging global demand for electric vehicles, while the weak result for raw materials may be partly due to weakening property markets as interest rates remain elevated.
The full Goods Trade Barometer is available here.
Further details on the methodology are contained in the technical note here.
Share
Reach us to explore global export and import deals